Wednesday, November 1, 2023

Transitioning to Data Science

Ask yourself questions:
Before you consider switching to data science, you should first ask whether you actually need to do so. Whether you have the necessary skillsets and aptitude to do so. This is because data science is purely applied math. It’s not really something cool, technical, or extremely high-tech. And if you don't love mathematics, you will hate it. Data science is not a kind of complex computer programming. Computer programming is used as a tool in data science. At its core, data science is essentially mathematics. And if you don't enjoy math, you won't like data science. 


If you don't enjoy programming, attempt to learn the basic fundamentals. You could try to delegate your programming, but at the very least, you need to have some appreciation for data, and that can only happen when you have some understanding of mathematics. If you think that trigonometry and calculus don’t have any practical applications, you probably aren't meant for data science. 

However, if you have advanced to the point where you feel that you have the necessary clarity of thought and are certain that you want to switch to data science. Then, there are two ways to go about doing that. First is the traditional method, and the unconventional method


Traditional Method of Transitioning to Data Science:
The traditional route is to en-roll in a data science programme. Do make sure that it must be a full-time programme offered by a reputed university. In Indian Context, the Indian Statistical Institute(ISI), the IISc Bangalore, the IITs, are great places to look for. This course must be a full-time course not a course that you would do over the weekend. You must dedicate one or two years to that programme, putting everything else on hold.


Unconventional Method of Transitioning to Data Science:
The unconventional approach is to complete some sort of data science project and build a portfolio. Then, using that to transition by getting recommendations from friends, understanding the specifics of a given data science job posting, and working to improve on the same. If you start applying to 10–20 data science positions, and you prepare for every position in a very specific way over the course of, say, five-six months or a year, you will know what you need to do, to be a successful Data Scientist.

Now the question arises: How do you build a portfolio, and how do you create data science projects from scratch? To do that, you have to identify problems in your life that you care deeply about and turn those into data science projects. Either solve those problems or at the very least find an approach and try to consider what might be a potential solution. If you believe that, while you have identified a data science problem, you are stuck somewhere or that you do not actually have a data science problem to solve, I've made a number of videos explaining how to start data science projects and what sorts of projects fall under the data science umbrella. You may watch those videos. 

You can get in touch with me through email, a message on LinkedIn, Instagram, or through visiting my verified Topmate profile: https://topmate.io/ashish_gourav

Friday, October 6, 2023

Use ChatGPT to become a 10x Professional

ChatGPT is an advanced language model developed by OpenAI that has gained widespread recognition and adoption across various industries. It utilizes deep learning techniques to generate human-like responses and engage in interactive conversations with users. The capabilities of ChatGPT extend far beyond simple question-answering, making it an invaluable tool for businesses and individuals alike. 

Let us look into the most efficient usage of the superpowers of ChatGPT in detail.

Learn the basics of any new topic
Suppose that you want to learn about NLP, which is a completely alien topic for you. You can simply enter it in ChatGPT and you will get a detailed article on NLP.

Search faster
You are just a click away to search a topic. In ChatGPT, you can get the results within a fraction of seconds.

Code Faster
You can even code faster using ChatGPT. You have to just write the instructions for the code you require. ChatGPT will do it for you for your choice of language.

Pop cultural references
Along with all these benefits, you can also get pop cultural references in ChatGPT. For example, type “Movies for Gen Z”, you will get a list of the most popular movies that appeal to the Gen Z demographic.

Learn specific things of a difficult topic
You can also learn any particular detail of a difficult topic using ChatGPT.


These applications represent just a glimpse into the diverse possibilities offered by ChatGPT's superpowers. As technology continues to advance, the potential for leveraging ChatGPT in innovative and impactful ways will only expand, benefiting individuals, businesses, and society as a whole.

None of these things are replacements of existing technology or human beings. But these all are applications which human beings will use, which technologies will use. In this way, ChatGPT will enable both technology and human beings to perform efficiently.

ChatGPT or any other technology like ChatGPT will not be something which will be impediment or disruptive to your career progress. It will be helping you becoming a smarter person. It will help you becoming a smarter professional and a more efficient individual. And, I have maintained this stance from the last 10-15 years of my adulthood days that technology is always an enabler and stimulant, it can never replace human beings, it can never replace old technologies. There are people who use low-tech or old technologies because it is easy for them to use. But yes, given time everything dies because everything comes with an expiry date.


Artificial Intelligence & Machine Learning's Most Important Concepts for Interviews

Let’s learn the most important concepts of Artificial Intelligence and Machine Learning through alphabets!

ANN
Artificial Neural Network (ANN) mimics the human brain’s neural network. Hidden units of the hidden layer in the artificial neural network architecture can be thought of as Neurons and they introduce non-linearity with inputs and few biases.


Bagging

Bagging means making multiple training sets from a training set and training separate models on those separate training sets and finally averaging them out.


Correlation
Correlation measures the relationship between two features or variables.


Deep Learning
The cornerstone of deep learning is artificial neural networks. Whenever you have artificial neural network with many hidden layers, its most likely a deep learning problem which is being solved.


Error
In a supervised machine learning setup, you always have an actual number on which you are supervising the model and a predicted and an estimated number and the difference between these two numbers is error. You tend to minimise the error in these kinds of machine learning problems which are a kind of supervised machine learning problems.


Feature
Feature or variable or input, all it means is what you feed into your data science models.


Gradient Descent
Gradient descent is a way to approximate global minima using local minima following an Iterative approach.


Hypothesis Testing
Using test statistic, you either reject the null hypothesis in the favour of alternative or fail to reject the null.


Intercept
Intercept in linear regression is that parameter which has the same impact for all inputs. For example, if your intercept is 3, the impact of intercept on y will always be 3, irrespective of x.


Julia
Julia is the next breakthrough in data science programming, as it is specially designed for quantitative researchers or data scientists.


KNN
K-Nearest Neighbours or KNN is the method which can be adopted to both regression and classification. The key idea here is that here you find K nearest points of any data point, and using this create a new model. And most importantly, this is a non-parametric model, here K is the hyper-parameter.


Linear Regression
Linear Regression is the simplest, yet the most powerful predictive ML Model. Its components are the intercept and coefficients of all the features or predictors. 


Model
Model is an abstraction or simplification of reality using mathematics and statistics.


Normal Distribution
People generally talk about normal distribution when they are new to data science. It is not the only statistical distribution of importance. There are others as well. To completely identify a normal distribution, you need its mean and variance. And the heuristics to understand whether a distribution is normal or not, is that it will be symmetric about its mean with bell shape. 


Overfitting
Overfitting is prone to happen when the model is too complex, fits the training data well but fails miserably when presented with new data.


P- Value
P-value measures the strength of rejection or failure to rejection. In statistical terms, it is the observed level of significance.


Q-Q Plot
Q-Q Plot compares two probability distributions. It is a Test for Normality.


Random Forest
Random forest combines the number of decision trees similar to bagging with a twist on the choice of features while making the decision trees.


SVD
SVD along with PCA is a dimension reduction technique and if you feed into it p features, when p is very large, it gives you a smaller set of modified features. In PCA terms, most important principal components which helps you in reducing the dimensionality of the problem.


T Test
T-test in statistical terms is a statistical test to compare means of two different distributions.


Underfitting
Underfitting is the opposite of overfitting. It is a deficient model which has missed out on important patterns or features while training a model.


Variance
Variance measures how spread the data is about the mean. So, if a data set is 2, 2, 2, 2…., it will definitely have a very low variance, which in this case is zero. And, if let’s say, data is 2, 5, 10, 15, 30, definitely its variance is going to be very high and not zero.


Web Scraping
Web Scraping is a risky way to get data from websites. Hence, read all the possible violations while doing web scraping. 


X (Inputs)
X is what you now.


Y (Outputs)
Y is what you need to know.


Z-Score
Z-Score measures how far data point is from the mean. In terms of standard deviation, just subtract the mean from the data point and divide it by the standard deviation.


Thursday, August 10, 2023

IPO Investing Strategy - High Return & Low Risk

In this post, you will get to know, how one can gain in IPOs, without investing in IPOs. The strategy I am going to describe will be very helpful to you and it will take only few minutes of research. It is a very high probability and a low-risk strategy. 

I invest my money only when I have the utmost clarity of low risk and high reward. My way of investment in stock markets is purely academic in nature. So, my fund size and risk tolerance remain small. The moment the money at risk is small and the risk is also small, you ultimately cannot become rich. You might have an outstanding return, but you will not become a millionaire overnight. You will be in a slow and steady path towards learning how stock market investing works. 

What is my strategy?


As I described, my strategy does not take much research, but that comes with the experience which I have about stock market investing. Essentially, whenever there is an IPO buzz happening around, I do not subscribe to the IPO. Instead, I wait for the listing day. Just before the listing happens, I check three things:

Grey Market Premium:
Grey Market Premium is the first common thing which is checked by a lot of people. For the sake of clarity, let me tell you about grey market premium. It is the premium the stock is trading at, in the grey market. It is not a formal market, and as the name suggests, it is not very mainstream in nature. So, it’s like a Mock Test for IPO. If you have a positive grey market premium, there is a very high chance that on the listing day, you will have a positive return on that stock IPO. 


Nature of the Business:
The second signal is the nature of business. If you feel that the business prospect is good, then you have a positive signal number two. Now, how would you find that out, that is your skill, that is an art not a science. 


Subscription Status:
The third signal is the subscription status, was it 2, 3 or 5 times subscribed. You can have a very high subscription, but might not get positive returns on the listing day and you might have a very tepid kind of subscription, but you still might get positive returns on the listing day. So, this is a very fuzzy area. You have to have an intuition about these things.

Once you have the above three positive signals or rather let’s just take two positive signals out of the three, you move on to the second last stage.

What is the second last stage?
You go on to a trading platform, just few minutes before you put your money into it, check the trade lots, how many people are selling, how many people are buying. I use a full-service trading account, so I get this information pretty easily and I don’t know about the discount brokers, if they have such facilities, where they give you what is the trade lot, how many people are buying, how many people are selling.

After I gain confidence that yes! more people are buying than selling, my task is almost dome. I put my money and wait for the stock price to go up. Ideal scenario is that I do not just wait. I set up an automated order on sell, so whenever the price crosses a certain percentage, like 12-15% (in my case) on the listing day, I exit out of the market.
So, this puts an upper cap on my investment returns, but I am willing to do that, because in just a matter of few minutes or sometimes few hours I have around 10-12 percent returns, which is fair enough for me as I am not putting that in-depth research into that investment. It is just a 5-10 minutes of work for me and I am sitting on more than 10-12 percent of investment returns.
The moment I increase my fund size and increase a bit of my risk tolerance, then I will have substantial gains at a higher risk. That might not work for me, because the risk which you take has consequences and it’s not a lottery or a gamble. It’s just how numbers & probability work.

Saturday, July 1, 2023

How to Make Money with Stock Market Investing

In this blog, you will come to know about tips and tricks about investing in stock market. You have to assume that in the worst case, you may lose out all the amount of money or the corpus of money which you are putting in the stock market. So, if you are ready to take that kind of risk, then invariably, you will land into few opportunities which will give you disproportionate gains.

So, following are my simple rules for investing in stock market:

  1. Try to invest in two to three companies every six months and do not take out your money after suffering initial losses. Try to keep invested in the stock market for good amount of time.


  1. Set your targets before investing. Let us say if you are investing in Company A, so your target set is that you want to gain 30 percent from this company in one month. Suppose that within only two days, the company rises by 30 percent, but you should not be greedy and just take out that money. Your target was to achieve either minus 5 percent of loss in this company or thirty percent in two years. So, In the year time frame, whenever the company goes below minus five percent, you have to sell or whenever the company goes above 30 percent, you have to sell.

Therefore, try to keep a lower and upper cap for your investment criteria for every stock. Once you do that, you will always be a rule-based investor or trader and then it would not be difficult for you to overcome your behavioural tendencies. 

Stock market investing is easy, but it is the people who invest make it difficult and it is the behavioural aspects of a person which makes investing quite difficult in nature. The idea here is that a part of it is an art, it is not a very hard science. So, you need to learn, how to master this art of investing. 


  1. To master the exit point is decided by your behavioural tendencies. So, I would suggest you to read a bit of economics, behavioural finance, psychology and investment behaviours and then understand how to get over this.


  1. Whenever you invest in a company, try to first look out for P/E ratios. When you look for P/E ratios, what happens is that whichever company has a higher P/E ratio than their peers, might be a high growth company, or there is some kind of overpricing in the company, or there is some kind of manipulations in the company’s share. So, try to avoid such companies which have more P/E ratio than their peers.


  1. Dividend Yield

Try to look for companies which give predictable dividends. If a company is giving you a predictable dividend, you can earn money without even exiting the market. So, keep invested in a company which is giving you a consistent dividend. There is also a downside to those dividend companies, but still, the downside is not that great because if you are getting money on a regular basis, you also get appreciation of stock market and also get the dividend income.


  1. Current Debt

If their current debt which can be found in the balance sheet of the company, is of the same order as their current cash, then that company has a reasonable health. 


  1. EBITDA If EBITDA and profits are very different from each other like half of each other, then you need to see that why the EBITDA is so different than the net profits.


Hence, there are many rules for investing in stock market. Once you start searching how to invest, then you can go down the rabbit hole of investing. But the key idea here is that you need to learn continuously or else you will keep finding investing as gambling.


Tuesday, June 27, 2023

Can Economists become Data Scientists

It is a well-known fact that the key role of an economist is optimisation of costs for the maximisation of payoffs. Data scientists also perform a relatively similar job. They too optimise the cost functions to maximise the model fit. They both are highly interlinked job profiles. The tools that economists and data scientists use are the same. Perhaps, economists are the best suited to become data scientists, not engineers. 

Apart from the overt generalisations which have been mentioned above that economists optimise the payoffs and minimise the costs, it might not be true always.  But that is the general theme of economics because economics is based on resource constraints. Resources are scarce, so the use of available resources needs to be optimised. 

The same happens with data scientists. Data scientists don’t have a lot of data or their clients or their problems don’t have really infinite resources. Some kind of modulations is needed be given to those resources, so that they are getting optimised appropriately. There are a plenty of data science problems in which resources are to be optimised and payoffs are to be maximised.

Generally, economists used data science as one of its tools and one of its techniques. And, data scientists are all technique. So, if you are a data scientist, without a domain expertise, you are a kind of technician. But suppose that you have a domain expertise, maybe you are a healthcare data scientist, so you are high in demand having a specific skill set. So, an economist and a domain specific data scientists have a lot in common.

Tools You must know that in economics, there is something called econometrics which essentially comprises of a lot of regression. Also, if you begin any data science course or any machine learning course, they will start teaching you regression, simple and multiple correlation, and what happens when your data has some kind of deviation from the assumptions of regression. These are the specific things which are discussed in detail in econometrics because econometrics is perhaps the most powerful tool of economics. Economics uses statistics, math, econometrics and a lot of other tools, which are analytical in nature and so does the data science industry. Therefore, economists are well suited to become a data scientist.

Are Software Engineers better Data Scientists or Product Managers or MBAs? Software engineers have an extremely difficult task at hand and they are quite good at it. But just because data science has a bit of coding in its ambit, you cannot say that software engineers are better suited to become data scientists. But yes, software engineers come in a lot of shapes and forms, so may be there is a specific kind of software engineer who really is specializing in the artificial intelligence and machine learning domain. So they are quite invaluable data scientists. But you cannot say that all software engineers are meant to be data scientists. There is a subset of software engineers which is kind of connected to data science. But economics loosely is all about analytical tools and using models to describe the ideas, the theories and the philosophies, that ultimately run the trade of goods and services. Therefore, it can be said that an economist will be a traditional data scientist and an AI/ML software engineer will be a kind of maverick and that person will really bring in cutting edge innovation in data science and both of them are needed.

So, if you still have a question that on studying economics can make you a data analyst or a data scientist. The answer is yes, but the only point over here is that if you are beginning your economics education, don’t think it through like this will be a stepping stone to a data science career. If you want to study data science, these days there are specialised courses in data science. Now a days, there are a lot of practitioners in data science not really trained in data science. They have just become one. But in future, data scientists are going to be trained. So, if you really believe that this is what you want to do in your life, you can find a plenty of resources for that. But if you believe that you want to become an economist, then do so and study economics because economics also is a pretty interesting field of study and it has a lot of value. The predictions which economists make is just one part of the value pyramid and it has a very high degree of explanatory power and interpretation which an artificial neutral networks or the ML models don’t have. They are a kind of black box models. This is the main reason why economists bring a lot of value to data science.

So don’t be scared of switching from economics to data science, because they are really close siblings.

Monday, April 24, 2023

How I became a Data Scientist at Big 4

Engineering Days

I began my quest of becoming a data scientist long before it was promoted as the hottest job of the century. I had no idea I was on the path to becoming a Data Scientist. It all started in my second year of B.Tech. I began to consider which career option to pursue next. I was fairly certain that I would not continue my engineering studies. Then, Actuarial Science was suggested to me, and I realised that this may be an interesting career for me. But I abandoned the notion because it required years of writing countless exams. At that point of my engineering, my thoughts were that I am done with my education, and now it was time to start my profession and start making money. How wrong was I!!


CFA Level 1

I started looking for jobs that required Maths. It was always in the back of my mind that if Actuarial Science was necessary for the job, I could pursue it. Later, I realised that Finance will have a lot of Mathematics that I will enjoy, so I passed CFA level 1. CFA level 1 provided me with sufficient finance knowledge, and I was not applying the knowledge in my everyday job position, so I saw no use in pursuing any further levels.

ISI and CMI

I was thinking about the ISI MSQE programme at the same time. This is a Maths & Economics course, and after passing the CFA Level 1 exam, I learned that Economics is the science of Finance. 

I arrived at ISI for MSQE programme after a lengthy delay. I studied quantitative economics, and this was one of the few correct steps towards becoming a Data Scientist. Though, this is not a straight path. 

I had also qualified for the CMI data science course when I first joined ISI. But I chose ISI Kolkata over CMI because I wanted to study at ISI. The fact that MSQE offers courses in Math, Economics, Statistics, and Finance and they are related to Data Science, was another logical justification.

Becoming a Data Scientist

I gave numerous internship interviews at ISI before receiving a Data Science internship at a gaming company. I then started to apply for jobs, and I eventually got a Data Science position at a consulting firm. Although I wouldn't describe myself as an experienced Data Scientist at that point of time, but I was always crunching numbers in some capacity. Any kind of data analysis be it in Finance, or Economics or hardcore Data Science, can be referred as a Data Science, and data was involved in my work. The work you perform in the course of your employment determines whether you are a Data Scientist or not, not your job title.

I therefore became a Data Scientist after receiving education and training in Engineering and Economics, and this is what happens for many other people as well. In most cases, they are not trained to be Data Scientists; instead, they become one.

Wednesday, March 29, 2023

Secrets of Time Series Forecasting & its Statistical Nuances

A time series is a collection of data points gathered over time that can be used to analyse & forecast trends and patterns. Working with time series data requires caution because one wrong step can lead to misleading results. The three things to consider when working with time series data are as follows:

Spurious Correlation:
When we have two time series datasets that are highly dependent on the passage of time. Examples include stock market index data over time and the number of goals scored by a footballer over time. Because the factors are highly dependent on time, the values for both datasets are bound to rise in the long run, say 5-6 years. If you calculate the correlation between them, you'll find that it's extremely positive. However, this does not imply that the variables, stock market data and football goals, are in any way related. The increase in values is due to the passage of time, which results in a positive correlation. Because there is ultimately no casual relationship between them, we are unable to determine if they are related in any manner or not. There is no link of any type between stock market data and a football player's goals scored.


Series or Order of Data:
The word "series" is used in Time Series for a specific reason. The reason is that while working with time series, the order of the data is crucial. We cannot randomly shuffle the data and take out a fragment of data to perform our analysis on it.  The order of the data is critical, and we must take it seriously. We must be extra cautious when performing any training/test or cross validation because these steps require some form of series shuffling, which somehow diminishes the core concept behind the series.


Duration of Data:
Consider a scenario in which you want to perform some sort of time series forecasting. You might be tempted to do this with only a few years' worth of data. But keep in mind that you will need at least three to four years of data to perform any kind of reasonable time series forecasting because only if you have that much data, you will be able to observe seasonality.

Let’s understand what this term seasonality means. Seasonality in time series refers to the presence of repeating patterns over a set period of time. These patterns may be impacted by regular occurrences such as the season or holidays; Seasonality can be seen in a variety of time series data, including product sales, website traffic, and weather patterns. These patterns can have a substantial impact on how data is interpreted and the accuracy of forecasts.

We have to be careful not only in using data for a shorter period but also be very careful while using the data of 7 or 8 years. The reason to be extra cautious in a longer period is the structural breaks which could happen in the long run.  A structural break in a time series refers to a significant modification of the method used to produce the data, such as a sudden change in trend or a modification in the correlation between variables. Time series data analysis and forecasting may be significantly impacted by these breaks. 

These above 3 points must be considered to improve your time series analysis forecasting.

Tuesday, March 14, 2023

The problem with pooled data - Simpson's Paradox - Grouped Data

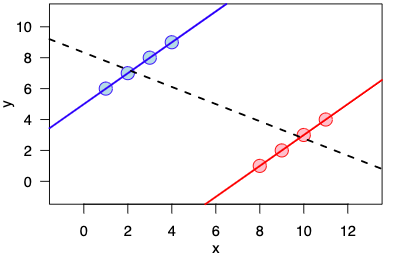
Simpson's Paradox occurs when the direction or strength of an association between two variables changes when data is divided into subgroups. In 1951, statistician Edward Simpson described the paradox for the first time. When data is split, a trend or relationship that was observed in a group of data points disappears or reverses. 


Let’s understand Simpson’s Paradox by an example. Assume a university is comparing the admission rates of male and female applicants over the last five years. The overall admission rate is 54%, but when the data is broken down by gender, the admission rate for male applicants is 70%, while it is only 50% for female applicants.


All

Male

Female

Applicants

Admitted

Applicants

Admitted

Applicants

Admitted

1000

54%

650

70%

350

50%


When there is a confounding variable that is related to both the independent and dependent variables, this dilemma occurs. Confounding variable means an extraneous variable which is correlated with both dependent and independent variables. The confounding variable in this example is the department to which the applicants are applying. Male candidates predominate in departments with greater acceptance rates, while female applicants predominate in departments with lower admission rates. As a result, when the data is pooled across all departments, male candidates appear to have a greater admission rate than female applicants.


Department

All

Male

Female

Applicants

Admitted

Applicants

Admitted

Applicants

Admitted

A

250

31%

90

38%

160

34%

B

290

42%

180

48%

110

42%

C

460

75%

380

85%

80

81%


The examination of medical therapies is another example of Simpson's Paradox. Assume a new medicine is being tested for its efficacy in treating a specific condition. In a clinical trial, the medicine was shown to be successful in the majority of patients, with 80% showing improvement. However, when the data is broken down by age, it is discovered that the medicine is only helpful for those over the age of 60. This paradox emerges because the patients' age is a confounding element that influences the link between treatment and illness improvement.


To prevent Simpson's Paradox, it is critical to identify and analyse relevant confounding variables. One method is to stratify the data by the confounding variable and study each subgroup individually. In the case of university admissions, stratifying the data by department reveals the true relationship between gender and admission rate. Another option is to control for the confounding variable using regression analysis. This can help to determine the true relationship between the independent and dependent variables.


For making decisions and creating policies, Simpson's Paradox has serious repercussions.  It implies that more detailed data analysis is necessary because aggregate data can be misleading. It might not be ethical to recommend a medical procedure to all patients, for instance, if a clinical trial reveals that it is successful but later research reveals that it only works for a particular subgroup of patients. 


In summary, Simpson's Paradox is a statistical phenomenon that can happen in the presence of a confounding variable. If data are only examined at an aggregate level, it may result in false conclusions. It is necessary to recognise potential confounding variables and analyse them appropriately, either by stratifying the data or by using regression analysis, in order to avoid Simpson's Paradox. Making informed decisions and developing effective policies based on data analysis require an understanding of Simpson's Paradox.


Wednesday, February 8, 2023

3 Tips for Finding your Data Science Project Idea

Projects are an essential part of learning data science. And, deciding on a topic for a project is a tough nut to crack. Here I have shared my experience & a three-step formula to find a personal project idea.

If you have decided to work on a project, think like a doctor. What does that mean? 

Think about what are the things that can improve your day-to-day life with the help of data. You'll come across a lot of problems. And one such problem is your data science project.

Think of a problem you might be facing that can somehow be connected with data. Now ask the question, can you solve it with data?

If your answer is no. You can learn & revisit more topics in Data Science.

If your answer is yes, it means you have hit the right target and you are thinking in a suitable direction.
If still, you are not sure how you'll solve the problem i.e. what data-driven approach should be followed to solve the problem statement, you can follow the following 3 steps technique after figuring out the problem statement 


1) Approach: You have to figure out what kind of method you should prefer to solve the problem. Does it require machine learning, mathematical programming, mathematical analysis or something more advanced

2) Data: Next step is to find the relevant data according to your problem. Is it available on the internet, or do you need to scrape it? Is the data structured or unstructured, and how do you clean and preprocess the data? These are some questions that you need to ask yourself to get quality data for your problem statement.

3) Result: Once you get the data and you have applied the chosen approach, it's time to present the solution to the general audience. Writing a detailed report of your findings is the best way to present your project. The report also helps the key persons to understand your project without going through each line of code.


This 3 step technique does wonders not only for personal projects but also for professional projects.

Let's understand by an example how to use this 3 step approach to a given problem statement.

Problem: How to increase subscribers of a YouTube channel?
(Disclaimer:
The youtube algorithm is far more advanced than the solution presented here. The solution is just to understand the strategy)

1. Approach: This problem may require machine learning techniques like Regression, Random forest, or advanced techniques like Neural Networks.

2. Data: There are many ways to get the data of a YouTube channel. We can use the YouTube API, or we can ask the owner of channel.

3. Result: The way we present the result is the most important thing. Saying something like, "make quality content for a youtube channel" as a result might not be an effective answer to the given problem statement. 


The result should be specific, actionable, and personalised. Mentioning something like, "Posting twice a week, replying to all comments, uploading videos in the evening, etc are the key insights from the data & analysis, that have increased the engagement & retention in the past, so following these tips will help in gaining subscribers.'' will be very effective.


So, the overall summary for finding a suitable data science project is:
Look for problems - Can the problems be solved with the help of data? - Solve them using 3 step technique (Approach - Data - Result)


Data Engineer vs Data Analyst vs Data Scientist - A Practical Comparison & Perspective!

There are various Data roles like Data Scientists, Data Engineers, Data Analysts, etc. Having a clear difference amongst these roles is important, so that you can select the most appropriate path for your journey. Below is a brief description & differences amongst the three roles: Data Engineer, Data Scientist, and Data Analyst.

Data Engineer: Data Engineer is a person who is given the task to get and handle the data. Data engineers are well acquainted with coding and algorithms. They use these algorithms for data cleaning and data handling.  

In current times, data is considered a valuable asset, so data engineers are responsible for maintaining the entire data architecture and data pipeline for an organisation. They handle raw & unstructured data and convert it into a usable format so that the data can be made available for further analysis to Data Scientists and Data Analysts. 

Data Engineers are not directly involved in the decision-making of a business. They work as a backend for the entire data team and indirectly help in data-driven decisions. Tools like SQL, MongoDB, Python, etc. are used by Data Engineers.

Data Analyst: Data Analyst is the person next in the pipeline of a data science project. They receive data from data engineers and perform analysis like EDA or any kind of elementary analysis. They analyse the structured data to find useful insights.

Data analysts use descriptive and inferential statistics for data analysis. Finding KPIs, and preparing reports are some of the day-to-day work of data analysts. They understand the current situation of an organisation and suggest recommendations for improvement.

The work of data analysts impacts the business directly. They suggest basic data-driven solutions that might be valuable for an organisation. 

Data analysts use spreadsheet tools like excel and google sheets and dashboarding tools like Rshiny, Power BI and Tableau. Sometimes programming languages like Python are also used for data analytics. SQL is also widely used by Data Analysts.

Data Scientist: Data scientists are the key assets for all the data-related activities in an organisation. They are responsible for all the model development & deployment, checking the performance of models in production, and enhancing the existing model. 

Data scientists possess the knowledge and understanding of Maths & Statistics, Programming Languages, and Machine Learning, as their task requires the use of all these three components. 

Data scientists handle semi-structured or structured data and perform data preprocessing. Various ML models are applied according to the requirements and problem statement. They maintain the accuracy & performance of models that are part of a data science project.       

The work of data scientists is helpful for businesses in predicting future events. Data scientists are directly involved in business decision making.

Data scientists extensively use programming languages like Python, R or SAS. (recently, Julia!)

Data scientists also perform elementary tasks like EDA, which are also done by Data Analysts. 

Sometimes the roles of Data Analyst and Data Scientist are overlapping. In many firms, the Data Analyst can do the work of Data Scientists and vice versa. It depends on the company & its requirements.

But this is not the case for Data engineers. Data engineers can be thought of as Software Engineers whose task is completely different from others.

So this is all about the role and responsibilities of Data Scientists, Data Analysts, and Data Engineers. Hope! now you have a clear understanding of each role.

Saturday, January 21, 2023

How to Learn Data Science Smartly in 2023

Data science is considered the fastest-growing field in current times. Many professionals & students are currently interested in transitioning to this domain. However, learning and moving into a new profession is challenging. It requires structured steps and a solid plan to efficiently crack the domain. So, here we have presented a detailed roadmap that will help you accomplish your goal.

Step 1: Start with any spreadsheet tool like excel or google sheets. Carry out data manipulation, draw graphs and try to find insights from any dataset of your choice.

Step 2: Move to any programming language, be it R or Python. The task is to perform the same analysis in R or Python that you did in the spreadsheet tool. You'll come across some libraries like dplyr, ggplot2, etc. in R and Numpy, Pandas, etc. in python. These libraries will help you in data analysis. 

To understand and master these libraries for data analysis, look over the internet, and you'll find a lot of tutorials for the same. Pick any one or at maximum two resources and start learning & implementing. In this process, you'll learn programming language as well as data analysis.

The best way to utilize the maximum from the above two steps is to always ask a lot of questions from the data. Then try to discover the answers with the help of excel, R and Python. This way, you'll not only learn the tool but would develop analytical thinking too.

Step 3: Now start studying statistics. Topics like conditional probability and Bayes theorem should be focused on. Then move to probability distribution, hypothesis testing, and statistical tests. The trick to master statistics is, first try to grasp basic ideas of multiple topics and then start solving the numerical problems. Then implement the learnings like probability distribution, hypothesis testing, and statistical tests in Excel and any programming language.

Congratulations! you have completed 50% of the journey and you are ahead of most of the beginner aspiring data scientists.

Step 4: Now comes the machine learning part. You’ll come across jargons like supervised and unsupervised learning, EDA, data preprocessing, and so on. But, don't get disheartened so easily. Start exploring why there is a such classification of topics, and what steps should be followed. Initially, don't try to understand everything, try to get an idea of the bare essentials. There are plenty of ideal resources out there for machine learning. Stick to a few of them.

Reaching this stage will roughly take anywhere between 3-4 months to 1 year. Now you are ready to work on quality and end-to-end projects. You can apply for internships or even jobs. If you want to study further, you can pursue higher studies in a good institute for data science.

Never get too hung up on completing the topics. Try to understand the why, when, and how of everything you are learning. The reason is, if you'll try to finish things in a short timeline, sooner or later you'll face issues in understanding the fundamentals of topics and you'll feel the need to revisit the topics. Hence, learn slowly but consistently.

It is said that "Little strokes fell great oaks"

All the best for your journey.

Sunday, January 15, 2023

Which One is Better for Data Science : IIT or ISI | Indian Statistical Institute Vs Indian Institute of Technology

Data Science, which is termed as the sexiest job of the 21st century has gained a lot of traction and eyeballs in the last few years. More and more people are trying to enter this field. And, to cope with the supply & demand, various institutes have started offering multiple programs related to Data Science, Machine Learning, or Artificial Intelligence. Two such premier institutes are IIT and ISI. These are known for their elite pedigree. But which one to prefer over the another? There are multiple deciding factors like location of the Institution, type of crowd, exposure, etc. We have focused on the curriculum/subjects, as it is the most important deciding factor.

Roughly speaking, we can divide the whole Data Science & Machine Learning work into two parts: Tech-focused and Statistics centric.


Tech-focused: This part of Data Science involves dealing with large sets of data, finding patterns in data using Machine Learning, AI models, and deploying the model in production. Coding or Programming is the key thing with an understanding of technology.

Examples include Advance Machine Learning, Deep Learning like Neutral Networks, etc.

Statistics Centric: This part of Data Science involves more of the explainable models, where most of the things depend on the parameters of the models. It involves the estimates of parameters which explain the complete model. Statistics & Maths are the key areas.

Examples include linear regression, statistical inference, time series forecasting, etc.

Disclaimer: Both ways are chosen individually or simultaneously for the given problem in different industries and different use cases.

Do you enjoy engineering more, or do you want theoretical studies more? That is the one question that should help you decide above anything else.

IITs are known to focus on engineering & technology whereas ISI has primarily a theme of Statistics.

If working in technology and coding appeals to you, then you can prefer IITs for Data Science. IITs are the best place to learn, work and implement technology with the brightest minds. 

If you have an interest in numbers, and you love mathematics and its application in the real world, then ISI is for you. ISI is the best place to understand the Statistics & Maths behind Machine Learning. You get a chance to understand explainable ML, and analysis part of Data Science & how it can help the business.

ISI primarily focuses on traditional statistics & maths. Coding, deployment, and application are the added layers. The situation is the other way round in IITs.

It's not like IITians never learn mathematics or statistics and ISI students never do coding. It's about the curriculum, environment, and culture that differentiates. 

Data Science is always a combination of Statistics, Programming, and Maths. Different institutes have different routes for this journey, giving priority to one section over another. At last, it boils down to your choice & preference.

Still, if you are confused now, the thing is you won't go wrong with either institute as both IITs and ISI are wonderful places to become Data scientists.