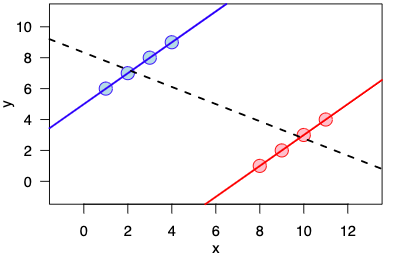
Simpson's Paradox occurs when the direction or strength of an association between two variables changes when data is divided into subgroups. In 1951, statistician Edward Simpson described the paradox for the first time. When data is split, a trend or relationship that was observed in a group of data points disappears or reverses.

Let’s understand Simpson’s Paradox by an example. Assume a university is comparing the admission rates of male and female applicants over the last five years. The overall admission rate is 54%, but when the data is broken down by gender, the admission rate for male applicants is 70%, while it is only 50% for female applicants.
When there is a confounding variable that is related to both the independent and dependent variables, this dilemma occurs. Confounding variable means an extraneous variable which is correlated with both dependent and independent variables. The confounding variable in this example is the department to which the applicants are applying. Male candidates predominate in departments with greater acceptance rates, while female applicants predominate in departments with lower admission rates. As a result, when the data is pooled across all departments, male candidates appear to have a greater admission rate than female applicants.
The examination of medical therapies is another example of Simpson's Paradox. Assume a new medicine is being tested for its efficacy in treating a specific condition. In a clinical trial, the medicine was shown to be successful in the majority of patients, with 80% showing improvement. However, when the data is broken down by age, it is discovered that the medicine is only helpful for those over the age of 60. This paradox emerges because the patients' age is a confounding element that influences the link between treatment and illness improvement.
To prevent Simpson's Paradox, it is critical to identify and analyse relevant confounding variables. One method is to stratify the data by the confounding variable and study each subgroup individually. In the case of university admissions, stratifying the data by department reveals the true relationship between gender and admission rate. Another option is to control for the confounding variable using regression analysis. This can help to determine the true relationship between the independent and dependent variables.
For making decisions and creating policies, Simpson's Paradox has serious repercussions. It implies that more detailed data analysis is necessary because aggregate data can be misleading. It might not be ethical to recommend a medical procedure to all patients, for instance, if a clinical trial reveals that it is successful but later research reveals that it only works for a particular subgroup of patients.
In summary, Simpson's Paradox is a statistical phenomenon that can happen in the presence of a confounding variable. If data are only examined at an aggregate level, it may result in false conclusions. It is necessary to recognise potential confounding variables and analyse them appropriately, either by stratifying the data or by using regression analysis, in order to avoid Simpson's Paradox. Making informed decisions and developing effective policies based on data analysis require an understanding of Simpson's Paradox.
No comments:
Post a Comment